Search

Search

Products

News

Turkish milling industry targets $5b exports, focuses on African markets in 2024

Turkish milling industry targets $5b exports, focuses on African markets in 2024

Amid global economic uncertainties, geopolitical strains and transformational waves of technology, Turkey’s flour milling sector stands resilient and poised for further expansion. In an exclusive interview with Miller Magazine, Zeki Demirtaşoğlu, President of The Association of Turkish Milling and Sector Machinery Manufacturers (DESMUD), unveils the secrets behind the sector’s enduring strength and the strategic vision steering Turkey’s flour milling powerhouse towards a record-breaking $5 billion in exports by the end of 2024.


Zeki Demirtaşoğlu
President of The Association of Turkish Milling
and Sector Machinery Manufacturers (DESMUD)

The Turkish flour milling sector continues to thrive amidst economic challenges, wars, and geopolitical tensions. Despite global economic tightening and conflicts, the Turkish milling sector exceeded expectations in 2023, reaching over $3.5 billion in exports. Looking ahead to 2024, the Turkish milling sector anticipates reaching $5 billion in exports. The spotlight is on Africa and Latin America as key target markets.

In an interview with Miller Magazine, Zeki Demirtaşoğlu, President of The Association of Turkish Milling and Sector Machinery Manufacturers (DESMUD), he shared valuable insights into the sector’s resilience and promising future. Demirtaşoğlu’s insights provide a comprehensive overview of Turkey’s flourishing milling machinery sector and its commitment to sustainable practices on the global stage.

How would you describe the current state of the milling  machinery sector in Turkey? 

The Turkish milling sector is the export leader in the world and has maintained this position for many years. We predict that this sector, in which about 300 large and small companies operate in Turkey, will maintain its leadership in the world in the coming years thanks to its competitiveness in costs and its superior performance in quality and service.

How was the overall performance of the sector in 2023?  Can you share the important achievements that stand out in 2023?

The Turkish milling sector concluded 2022 with exports amounting to 3.43 billion dollars and managed to exceed 3.5 billion dollars in 2023. Although precise figures are not available yet, this achievement is remarkable, considering the global economic tightening and conflicts during this period. We firmly believe that our industry will break a historical record by reaching the target of 5 billion dollars by the end of 2024. The milling sector continues to achieve significant successes in every field from storage, transport and unloading, grinding, sifting to automation, weighing and laboratory systems. The largest capacity flour, feed, starch and coffee factories in the world are established by Turkish milling machinery manufacturers. All of these facilities, where Industry 4.0 is used from storage operations to transport, grinding, sieving and automation systems, are operated by Turkish technicians.

What are the key challenges and opportunities that the sector is currently facing?

In a period of economic tightening in the world, states do not want to send the foreign currency they hold out of the country. For this reason, the Turkish milling machinery sector, which sells 94-97% of its production abroad, is experiencing difficulties in accessing loans for large investments to be made abroad, turning loans into cash and getting this cash out of the foreign country and coming to Turkey. For these reasons, unfortunately, many projects in the world have been postponed or some of them have been cancelled. These difficulties continue in a similar manner in all the countries we export to.

The pandemic that gripped the world for almost 3 years...Then the Russia-Ukraine war that broke out right on our doorstep...And finally the escalating tension in the Middle East. How was the sector affected by these global and geopolitical developments?

We expect the economic tightening model, which started in the USA and spread to the world, to come to an end in the third and fourth quarters of 2024. Therefore, the Turkish milling sector continues to prepare for the new period by strengthening its stocks. Our companies also continue the projects in their hands. Almost all of our milling machinery manufacturers have orders and projects for 1-1.5 years. In the third and fourth quarters of 2024, they aim to fulfil their factory production capacities for at least two years with orders for 2025 and 2026 by receiving new and strong orders.

The pandemic, the Russia-Ukraine war and the rising tension in the Middle East...All these have revealed how important access and accessibility to food and raw materials is, and brought food safety and security to the forefront. This process<

Discover

Events

Blog

The Critical Importance of Quality Control Parameters in Buckwheat Flour

The Critical Importance of Quality Control Parameters in Buckwheat Flour

1. What is Buckwheat Flour?

Although the name “wheat” appears in buckwheat, it is not a true cereal. It is obtained from the seeds of the plant Fagopyrum esculentum (Common Buckwheat), which belongs to the Polygonaceae (knotweed) family. After the plant flowers, a hard-shelled fruit called an “achene” forms, and the seed inside this fruit is called “buckwheat.” Therefore, buckwheat is classified as a fruit seed.

1.1 Structure of Buckwheat Flour and Its Effect on the Product

Buckwheat is a pseudocereal flour and naturally does not contain gluten. Gluten is a protein complex formed by the combination of gliadin and glutenin proteins, found only in true cereals such as wheat, barley, and corn, which belong to the grass family (Poaceae). These plants develop a structure to store energy in their seeds, known as gluten protein.

Since buckwheat does not belong to this family, it does not have this protein structure genetically. Instead, buckwheat contains a different protein composition made up of proteins called “globulin” and “albumin.” These structures distinguish buckwheat from true cereals.

1.2 Water Binding Capacity

While proteins in cereals form a sticky, elastic, gum-like gluten network that stretches and traps air bubbles when combined with water, the proteins in buckwheat bind tightly to each other when they come into contact with water and do not form an elastic chain. Buckwheat proteins absorb water like a sponge. As a result, the dough becomes heavier, but it becomes difficult to shape. Doughs made from this flour can easily break when handled. A denser consistency is obtained, and a viscoelastic structure cannot be achieved.

The logic behind the water-binding capacity of buckwheat flour lies in colloidal dispersion and viscous matrix phenomena.

Colloidal dispersion explains that when buckwheat flour mixes with water, the albumin and globulin proteins do not fully dissolve. Although the flour and water form a homogeneous mixture, these proteins remain as very small particles within the mixture. Therefore, buckwheat proteins create a suspension-like structure in the dough. Even though this structure allows interaction with water, the bond is not strong because these particles are not evenly distributed. This is why buckwheat flour cannot form a viscoelastic structure like wheat flour.

Viscous matrix refers to resistance to flow (viscosity) and the structural network formed by components. As the proteins and starch in buckwheat absorb water, they swell and move closer together, increasing friction between molecules. This increased friction reduces flow and increases viscosity, resulting in a thicker dough. Because of water absorption, the product becomes heavier. This dense, heavy, low-flow structure is called a viscous matrix.

For this reason, buckwheat bread is not airy but rather moist and dense. Gas bubbles cannot rise easily in this heavy structure and remain trapped inside.

2. Effect of Particle Size on Quality in Buckwheat Flour

2.1 Surface Area and Water Absorption

Particle size control is critical in buckwheat flour because it greatly affects the final product. Total surface area is one of the most important factors, as it directly influences water absorption capacity.

Figure 1: Structure of buckwheat grain

Buckwheat grains are harder and more angular compared to wheat. This geometric structure makes processing more complex. The tetrahedral shape of the grain makes milling and sieving processes highly sensitive, where every adjustment significantly affects the final product.

2.2 Negative Effects of Not Performing Sieve Analysis in Fine Flour

During milling, wheat grains are round, allowing force from rollers to be evenly distributed. However, buckwheat grains are angular, so this uniformity cannot be achieved. When rollers contact the sharp edges, they break explosively, producing very fine particles.

Even slight adjustments in milling can result in excessive fine powder. If the roller gap is too narrow and speed is high, very fine flour is produced. This also increases damaged starch due to high pressure. Increased damaged starch allows water to enter easily, and combined with increased surface area, water absorption becomes excessive and uncontrolled.

Since buckwheat lacks gluten, the only structure holding the dough together is the sticky network formed by hydrated proteins. Without sieve analysis, this leads to excessively sticky dough that can damage machinery and cannot be shaped. Such dough may remain undercooked during baking due to excessive water retention. It also negatively affects sensory quality, creating a sticky mouthfeel despite a homogeneous but lifeless texture.

2.3 Negative Effects of Not Performing Sieve Analysis in Coarse Flour

In loose milling, the hard outer shell and endosperm are not fully broken down due to wide sieve sizes or loose mill settings. This results in large, angular particles resembling semolina.

In coarse flour, water penetration is more difficult due to tighter molecular packing, slowing hydration. Without sieve analysis, bread crumb remains dry. Water migrates outward instead of being absorbed, evaporates during baking, and results in a dry, hard product.

Because gluten is absent, proteins cannot form a cohesive structure, leading to a crumbly texture. The product may feel gritty in the mouth, reducing perceived quality.

2.4 Non-Homogeneous Distribution Without Sieve Analysis

A mixture of both fine and coarse particles may form, leading to a combination of overly sticky inner structure and dry, crumbly outer structure.

2.5 Sieve Analysis with Bastak 8000

The Bastak 8000 Sieve Shaker is highly effective in balancing particle size, which directly affects water absorption, dough elasticity, and final product volume. It complies with ICC, CE, and ISO standards and ensures precision from roller adjustment control to daily production monitoring. By accurately determining particle distribution, it ensures consistent and balanced quality.

Figure 2: Bastak 8000 Sieve Shaker Device. Bastak Instruments, 2026, Ankara, Türkiye.


3. Effect of Moisture on Quality in Buckwheat Flour

Moisture content is directly related to the water in flour. Since buckwheat is rich in protein, fat, and carbohydrates, high moisture creates an environment suitable for microorganisms.

The typical moisture level is around 14%. However, especially in fine flours, exceeding this level can promote mold and fungal growth. This can affect color and lead to the formation of mycotoxins, posing health risks.

Buckwheat also contains higher natural fats compared to wheat. High moisture activates lipase enzymes, which break down fats into fatty acids, causing rancidity and unpleasant odors.

Moisture also causes clumping due to electrostatic interactions, leading to sieve blockage and increased machinery wear. High-moisture packaging causes condensation, reducing shelf life and damaging packaging.


3.1 Moisture Analysis with Bastak 16000

Evaluating moisture is essential for food safety and cost control. The Bastak 16000 Moisture Analyzer prevents purchasing excess water during raw material intake and reduces risks like mold, heating, and toxin formation during storage. It ensures long-term product durability through precise measurement.

Figure 3: Bastak 16000 Moisture Analyzer. Bastak Instruments, 2026, Ankara, Türkiye.


4. Ash Analysis Requirement in Buckwheat Flour

To determine flour purity and milling efficiency, ash analysis is required. This measures inorganic mineral content by burning flour at 550–900°C.

Buckwheat minerals (potassium, magnesium, phosphorus) are concentrated in the outer layers (pericarp and aleurone). The endosperm contains fewer minerals.

High ash indicates excessive inclusion of outer layers during milling, resulting in bran formation. This suggests coarse sieving or aggressive milling. While nutritionally rich, such flour has lower visual quality and is called whole buckwheat flour.

For better appearance, finer milling with lower mineral content is preferred.


4.1 Ash Analysis with Bastak 12000

Ash content is a key indicator of milling efficiency and product quality. The Bastak 12000 Ash Furnace, with PID-controlled precision, minimizes errors and ensures accurate results across various applications.

Figure 4: Bastak 12000 Ash Analysis Device. Bastak Instruments, 2026, Ankara, Türkiye.


5. Protein Analysis in Buckwheat Flour

Protein analysis provides insight into nutritional value and functional performance. Since buckwheat lacks gluten, protein plays a crucial structural role.

Buckwheat is rich in amino acids such as lysine and arginine. Low protein reduces product quality, causing weak structure, spreading during baking, and crumbling.

Proteins also affect water absorption. Lower protein requires more water, making dough consistency difficult to control.


5.1 Protein Analysis with Bastak NIR DA 9000

The Bastak NIR DA 9000 combines speed and accuracy using diode array spectroscopy to measure protein, gluten, moisture, and ash within seconds. Widely used in leading laboratories, it maximizes efficiency and simplifies complex analysis processes.

Figure 5: Bastak NIR DA 9000 Protein Analysis Device. Bastak Instruments, 2026, Ankara, Türkiye.

Discover
NIR Grain Analyzer vs. Traditional Methods: Which One Is Right for Your Flour Mill?

NIR Grain Analyzer vs. Traditional Methods: Which One Is Right for Your Flour Mill?

The continuous growth of the global population has brought food safety and sustainable production processes to a critical point. In this long and complex journey from field to table, establishing a precise grain quality control mechanism is an essential requirement to ensure proper traceability of the product from raw material to final product and to build the system on a solid foundation.

1. What is NIR Analysis and Why is it Important?

The grain sector is moving away from traditional methods such as Kjeldahl and Soxhlet, which are time-consuming, require extensive material usage, involve heavy chemical consumption, are prone to instability over time, and increase the likelihood of human error. These methods demand intensive labor, pose risks to human and environmental health, and may lead to serious long-term health issues.

Today, many reputable companies in the grain industry are transitioning to next-generation technologies based on Near-Infrared Reflectance (NIR) spectroscopy.

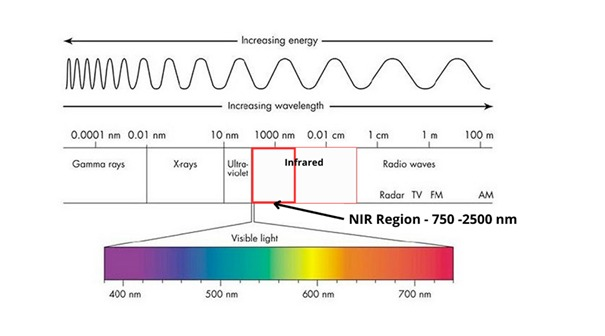
Figure 2. Representation of visible light and near-infrared (NIR) regions in the electromagnetic spectrum. The NIR region is defined within the range of 750–2500 nm (NIRLAB).

Differences between traditional gluten analysis methods not only impose significant economic burdens on producers but also create deviations in results that may lead to irreversible or difficult-to-correct issues in production processes. At this point, the BASTAK 9000 NIR device minimizes deviations and has a high capability to predict wheat functionality.

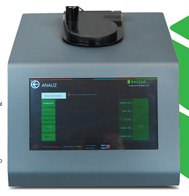
In today’s competitive food and agriculture industry, having high production capacity is not enough; producers must also prove product quality in a short time. The BASTAK DA (Diode Array) 9000 transforms long, complex, and error-prone laboratory processes into a fast, easy-to-use, high-precision analysis method with standardized measurement principles and a 13-inch LCD touchscreen interface.


2. Old Habits vs. NIR: Which One Moves You Forward?

2.1 Economic Losses, Penalties, and Waiting Times

In the modern flour industry, one of the most important conditions for profitability in sustainability is maintaining quality. Even small variations in quality can result in tons of defective products.

A single faulty shipment in a standard 25–30 ton truck can lead to economic losses ranging from $15,000 to $25,000. Especially in high-volume production, time must be managed efficiently. Reliable and rapid testing devices are essential in logistics.

Traditional methods such as Kjeldahl, oven drying, and manual gluten washing, although accurate, require long processing times:

  • Kjeldahl method: 2–4 hours per sample
  • Oven (moisture analysis): 1–2 hours + cooling time
  • Manual gluten washing: 45–60 minutes
  • Zeleny sedimentation test: requires shaking and long settling periods

These delays slow down laboratory workflows and increase costs. Trucks waiting for analysis results generate demurrage costs, and delays can lead to penalties, especially in maritime trade where container waiting costs are significantly higher.

The BASTAK 9000 NIR device delivers results within 30 seconds, providing critical parameters such as moisture, protein, ash, gluten, and Zeleny sedimentation quickly and accurately. This enables real-time decision-making and optimization of operational costs.

Scientific studies show that NIR systems operating within the 750–2500 nm wavelength range, combined with advanced algorithms, provide high accuracy in predicting grain quality.

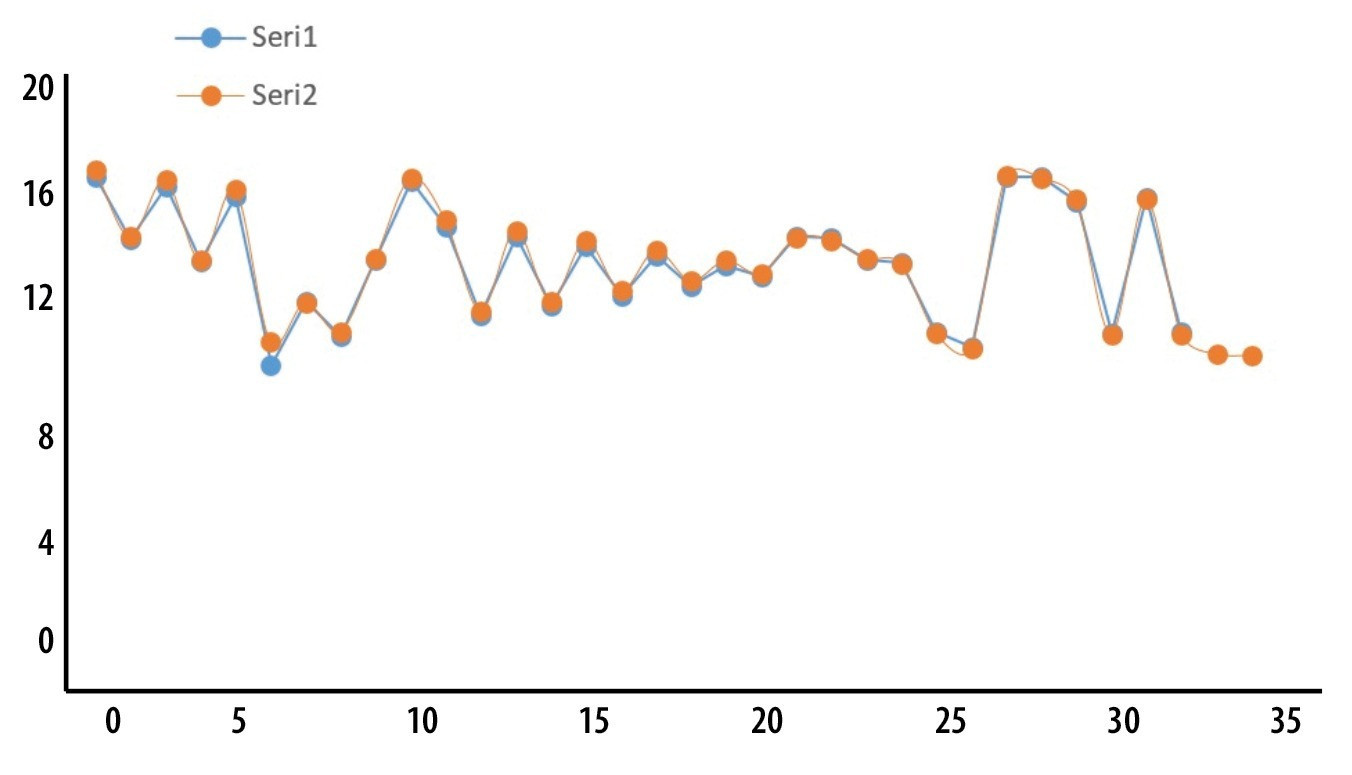
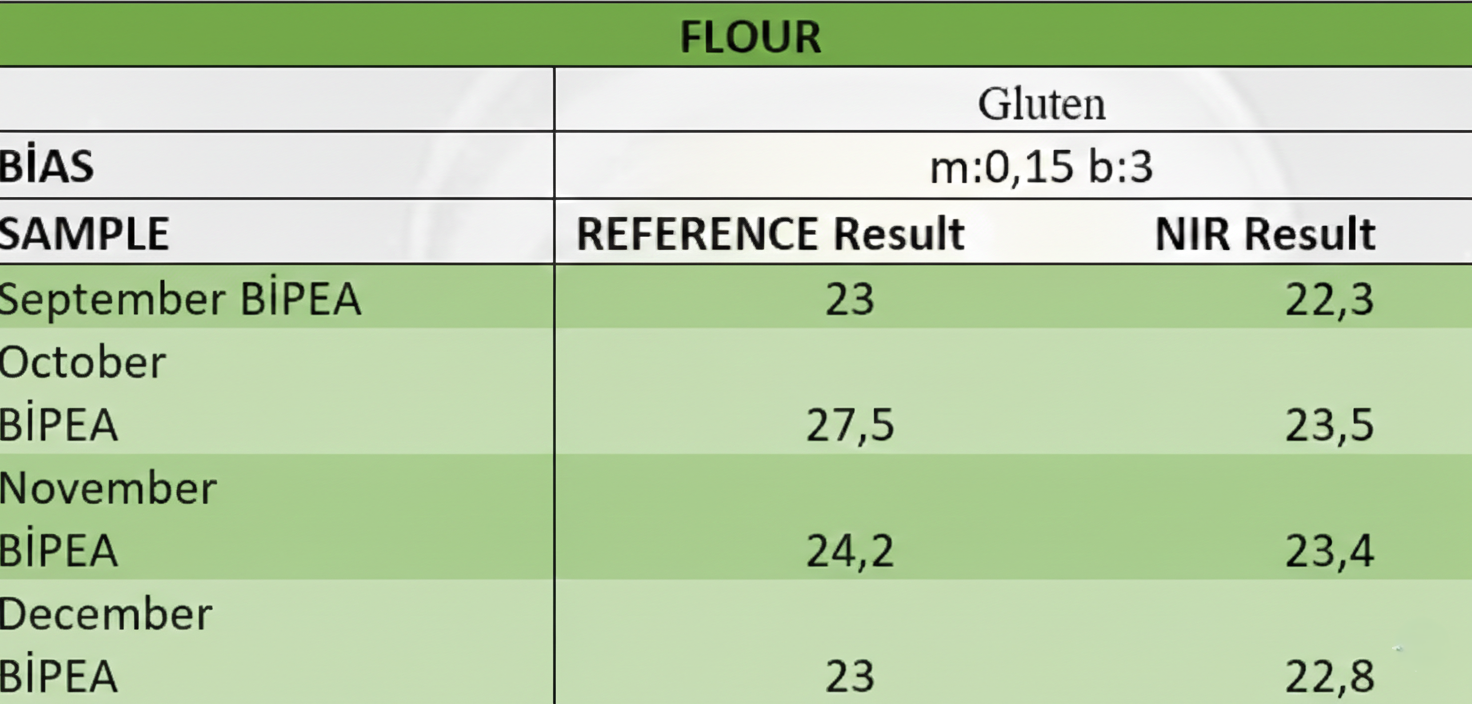
Comparative analyses conducted to evaluate the performance of the Bastak NIR DA 9000 used reference values from traditional (wet chemistry) methods:

  • Protein: Bastak Kjeldahl System
  • Gluten: Bastak 6000 and 6100 Gluten Cheq
  • Moisture: Bastak Oven

Results showed minimal deviation and high repeatability, with a correlation coefficient of 99%.

Blind Production, Profit Loss, and Energy Inefficiency

One of the biggest mistakes is adjusting machines based on outdated analysis results or operator experience. Wheat hardness and moisture vary, requiring precise adjustments.

Incorrect settings may lead to:

  • Excessive pressure → bran mixing → higher ash → lower quality
  • Insufficient grinding → repeated processing → up to 2x energy consumption
  • Overheating → protein denaturation → poor baking performance
  • Increased wear → reduced machine lifespan → higher maintenance costs

Without real-time data, even a small miscalculation (e.g., 0.5% protein difference) directly reduces profit margins.

Labor and Chemical Costs

Traditional methods require skilled labor, attention, and experience. Human error in weighing, titration, and process management affects accuracy.

Challenges include:

  • Need for trained chemists/laborants
  • Long training periods for new staff
  • Limited daily sample capacity
  • Increased workforce with higher sample volume

In contrast, the Bastak NIR DA 9000 eliminates operator-related errors and provides highly repeatable results within seconds.

Traditional methods also rely heavily on chemicals:

  • High chemical costs (e.g., Kjeldahl reagents)
  • Hazardous material storage requirements
  • Disposal regulations requiring licensed companies
  • Additional costs (filters, glassware, cleaning)

They also consume high energy due to equipment like:

  • Ash furnaces (500–900°C)
  • Drying ovens
  • Distillation units

The Bastak NIR system only consumes power during analysis and eliminates chemical usage, significantly reducing operational risks and costs.

3. Application Areas of BASTAK DA 9000 NIR Device

Academic Research and R&D:
Provides highly accurate and repeatable data, enabling faster and more reliable characterization of raw materials in research projects.

Licensed Warehouses:
Time is critical during product acceptance. The device enables rapid determination of protein and moisture, ensuring correct silo allocation and preventing losses.

Flour and Pasta Industry:
Maintaining final product quality requires stable raw materials. The device allows real-time monitoring of semolina quality and gluten levels, ensuring consistent production.

Bakery and Pastry Industry:
The Bastak NIR DA 9000 can be used across all flour-based sectors such as bread, cakes, biscuits, and croissants. It measures:

  • Oil absorption (critical for biscuits)
  • Moisture balance (affects cake structure)
  • Gluten quality (essential for elasticity in croissants)
Discover
How Protein Analysis Performed by 9000 NIR at BASTAK ?

How Protein Analysis Performed by 9000 NIR at BASTAK ?

Introduction

Protein analysis is one of the most critical quality parameters in cereals, flour, and cereal-based products, as protein content directly affects nutritional value, processing behavior, and final product quality. Conventional protein determination methods, although reliable, are often time-consuming, labor-intensive, and require chemical reagents. In response to the increasing demand for rapid, accurate, and environmentally friendly analytical techniques, Near Infrared (NIR) spectroscopy has become a widely accepted alternative in food quality control laboratories.

BASTAK Instruments 9000 NIR Analyzer is extensively used in leading quality control laboratories worldwide for rapid determination of protein and other quality parameters in wheat and flour samples, from raw material intake to final product control.


Working Principle of NIR Spectroscopy

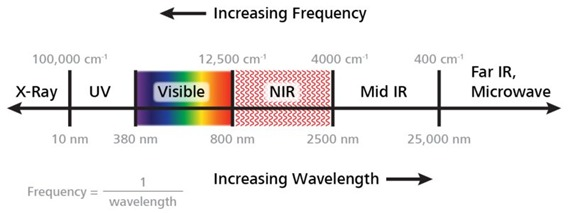
Near Infrared (NIR) spectroscopy is based on the absorption of electromagnetic radiation in the wavelength range of 780–2500 nm (corresponding to 4000–13,000 cm⁻¹). When NIR radiation interacts with a sample, specific chemical bonds absorb energy and undergo vibrational transitions.

In organic molecules, NIR absorption bands mainly arise from overtones and combination vibrations of fundamental molecular bonds such as –CH, –NH, and –OH. These absorption bands often overlap, creating complex spectra that reflect the overall chemical composition of the sample. By applying multivariate calibration models, these spectral patterns can be correlated with reference chemical values such as protein content.

Spectroscopic analysis, in general, relies on measuring and interpreting electromagnetic radiation absorbed or emitted as a result of molecular rotation, vibration, and electronic excitation. Among spectroscopic techniques used in food analysis, infrared spectroscopy and particularly NIR spectroscopy stands out due to its speed, non-destructive nature, and minimal sample preparation requirements.


BASTAK 9000 NIR Technology

BASTAK  9000 NIR Instruments operate on advanced near-infrared transformation principles and are designed for routine quality control applications. Thanks to BASTAK’s superior and robust NIR technology, the DA 9000 enables simultaneous and rapid measurement of multiple quality parameters within seconds.

Using this system, the following parameters can be determined in red bread wheat, white bread wheat, durum wheat, and flour samples:

  • Protein content
  • Gluten content
  • Moisture content
  • Ash content
  • Zeleny sedimentation value

 9000 NIR provides reliable results without the use of chemicals or reagents, making it an environmentally friendly (“green”) analytical solution suitable for high-throughput industrial laboratories.

Protein and Gluten Determination: Reference Methods

For calibration and validation purposes, conventional reference methods are still used. Total protein content is commonly determined by the Kjeldahl method in accordance with ISO 20483:2006, which measures total nitrogen and converts it to protein using a conversion factor. Gluten quality is traditionally evaluated by determining wet gluten using standardized mechanical methods (ISO, 2006).

Importance of Protein Analysis in Wheat Flour

Wheat flour is a key ingredient in a wide range of food products, including bread, cakes, biscuits, crackers, pasta, and noodles. Flour quality is generally characterized by parameters such as total protein, gluten quality, amylose, and amylopectin content. Among these, total protein and wet gluten content play decisive roles in determining dough rheology, processing suitability, and final product performance.

Accurate and rapid determination of these parameters allows manufacturers to:

  • Select the appropriate flour for specific product formulations
  • Optimize processing conditions
  • Ensure consistent product quality

Given the limitations of conventional methods, NIR spectroscopy implemented through instruments such as the BASTAK  9000 NIR provides a practical and efficient solution for modern flour and cereal analysis laboratories.

NIR-based protein analysis offers several advantages:

  • Rapid analysis (results within seconds)
  • No chemical reagents required
  • Minimal or no sample preparation
  • Non-destructive measurement
  • Reduced operational costs and environmental impact

Studies have shown that NIR spectroscopy provides reliable protein predictions when properly calibrated against reference methods, making it suitable for routine quality control applications.

Discover
QUALITY CONTROL IN COOKIES: ASSURANCE OF FLAVOR AND STANDARD

QUALITY CONTROL IN COOKIES: ASSURANCE OF FLAVOR AND STANDARD

By Bastak Instruments, MsC. Food Engineer,  Rabia Tiryaki.

Cookies, with their delicate and small structures, diverse flavors, and crispy yet firm textures, resemble a type of bread. However, they fundamentally differ from bread due to variations in fat, sugar, and water proportions. Compared to cakes, cookies differ in water content and dough consistency.


Cookies are one of the most popular snack types due to their availability, widely accepted taste and aroma, and longer shelf life compared to other snacks.

Regardless of size, using the right ingredients is crucial for delivering a high-quality product. The quality and composition of cookie flour significantly determine the appearance and texture of the final product.


Cookie flour, a critical component in cookie production, constitutes 30-40% of the total formula and is essential in producing high-quality cookies. Characterized by its low protein content, cookie flour influences the structure, spreadability, color tone, and texture (hardness, crispness, chewiness, stickiness, and breakability) of the cookies.

The type and amount of flour used in baking directly affect the quality of the finished product. Cookie recipes use distinctively low-protein flours derived from soft wheat.

Choosing the correct flour in cookie production is essential to avoid undesired hardness and chewiness caused by high-protein flour. Therefore, selecting the appropriate cookie flour and maintaining the correct fat-to-sugar ratio is fundamental to quality. As protein content decreases, the structural gluten in the dough also reduces, resulting in softer and more delicate cookies.


Spreadability is a key factor that requires careful consideration in cookie production. For most cookie types, a higher spread ratio is preferred. Spreadability is often associated with the glass transition of wheat proteins during baking. Cookies made with low-protein flours (below 12%) tend to spread more quickly and for a longer duration compared to those made with high-protein flours.


High-quality cookies should be crispy, and brittle, have a broad diameter and appropriate thickness, retain their crispness throughout their shelf life, and exhibit no sugar or fat blooming. The functional properties of gluten play a critical role in achieving these desired characteristics. The diameter and thickness of cookies, along with dough fluidity, are influenced by wheat storage proteins, gluten, and gliadin.


The water absorption capacity of flour significantly impacts the dough and the characteristics of the final product. Using less water may lead to stiff and dry dough, while excess water can make the dough sticky and difficult to process.


In cookie production, the damaged starch content is an important factor as it affects water absorption capacity and alters the dough's consistency. Excessively damaged starch can make the dough sticky and cause shape deformations.  Cookie quality is ensured through the proper quality control of the flour and dough used. Cookie flour, with its low protein content (8-12%), suitable starch damage (7-9%), moisture content (not exceeding 14%), and ash content (0.50-0.65%), determines the spreadability, crispness, and textural characteristics of cookies. While low protein content in flour creates a soft and delicate texture, excessive starch damage can cause the dough to become sticky. Similarly, the spreadability, elasticity, and moisture content (20-25%) of cookie dough directly influence the flavor and texture of the final product.


The elasticity and spreading properties of the dough are closely related to gluten structure and must be optimally controlled. The DA 9000 NIR Analyzer supports these processes by rapidly analyzing the protein, gluten, moisture, and ash values of flour. The Absograph 500 device determines water absorption capacity, contributing to cost and quality control. Additionally, the Bastak Gluten Q-System optimizes gluten quality, and the SDCheq 15000 device accurately measures damaged starch content, ensuring consistency in production. Proper management of these parameters enables the production of cookies that meet consumer expectations in flavor, texture, and shelf life.


Managing the quality parameters of cookie flour and dough effectively directly impacts the flavor, texture, and shelf life of the final product. Analyzing factors such as protein content, gluten quality, starch damage, and moisture provides producers with the opportunity to deliver higher-quality and more consistent products.


Flour

Moisture %

Protein (%)

Water Absorption (%)

Development Time (min)

Stability (min)

Degree of Softening AU

Sample 1

13,9

9,7

57,8

2

2,0

40

Sample 2

12,6

9,1

56,1

1,5

1,6

60

Sample 3

13,6

9,2

52,9

1,5

1,2

60


Discover
Nutrition Duel: Quinoa or Bulgur?

Nutrition Duel: Quinoa or Bulgur?

Nutrition Duel: Quinoa or Bulgur?

Nowadays, interest in healthy nutrition and various food alternatives is increasing. In this context, quinoa, which has gained popularity in recent years, has become widespread among healthy life enthusiasts. So, can quinoa really be considered an alternative to bulgur? Which food is healthier? We will evaluate these two foods by comparing them in detail.
Quinoa originates from South America and is a food that has been consumed for thousands of years. Quinoa, one of the staple foods of the Inca Empire, is not actually a grain. They are the seeds of a broad-leafed plant from the Chenopodiaceae family. It is classified as pseudo-cereal because its nutritional content is similar to grains. Quinoa attracts attention with its resistance to climatic conditions and high nutritional value. For this reason, 2013 was declared the International Year of Quinoa by the United Nations.

Bulgur, on the other hand, is a semi-cooked food obtained as a result of whole wheat grains going through the stages of boiling, drying, crushing and grinding. Bulgur, which has been in our kitchens for many years, is both a nutritious and economical food.

If we compare the nutritional properties of quinoa and bulgur:


The calorie content of quinoa and bulgur is similar; However, bulgur has lower calorie content. One small bowl of cooked quinoa contains 222 calories, while the same amount of bulgur contains 122 calories. The protein content of quinoa is higher than bulgur.To accurately measure protein, moisture, and fat levels in grains like quinoa and bulgur, laboratories often use advanced
NIR analyzers . Quinoa is an important food source, especially for vegans and vegetarians, with its high protein and quality amino acid content.
The fat content of quinoa is higher than bulgur. While 100 grams of bulgur contains 2 grams of fat, the same amount of quinoa contains 6.7 grams of fat. Quinoa is especially rich in linoleic and linolenic unsaturated fatty acids. In terms of fiber content, quinoa has a higher fiber content than other grains except buckwheat. Since quinoa is rich in dietary fiber, it supports the digestive system and contributes to blood sugar management. Bulgur has lower fiber content than quinoa, but still contributes to your daily fiber intake.
Quinoa is rich in carotene, a derivative of vitamin A, vitamin E and B group vitamins. It is also superior to many grains in terms of iron, magnesium, potassium and zinc minerals. Bulgur is especially rich in B vitamins such as niacin, thiamine and riboflavin. Niacin is important for the nervous and digestive systems and bulgur is a rich source of this vitamin.
Evaluating the glycemic index and satiety duration of quinoa and bulgur; Quinoa and bulgur have low glycemic indexes. Thanks to these properties, they do not cause sudden increases in blood sugar and keep you full for a long time. However, quinoa does not absorb as much water as bulgur during cooking, so the feeling of fullness may last longer when bulgur is consumed NILELITRE 7500 plays a key role in grain cooking, storage stability, and overall quality.

Quinoa does not contain gluten and is therefore an ideal food for celiac patients and people with gluten sensitivity. Bulgur contains gluten and therefore should not be consumed by celiac patients.
Quinoa contains high amounts of phytic acid and oxalates. Phytic acid reduces the absorption of minerals such as iron and zinc, while oxalates can cause problems for people prone to kidney stone formation. Therefore, soaking quinoa in water before consuming it is an effective method to reduce the amount of phytic acid.
Quinoa is just beginning to appear in kitchens and can be used in all dishes where bulgur is used. After the shells are removed, they can be used in dishes such as pilaf, barley, stuffed vegetables and stuffed vegetables. Additionally, pasta, pancakes, bread, biscuits, cakes and crackers can be made with quinoa flour.Before processing, grains such as quinoa and bulgur must be thoroughly SAMPLER CLEANER 13500 to remove dust and impurities. For accurate nutritional testing, grain samples are usually CRUSHING MILL 1600 Bulgur production also begins with wheat ROLLER MILL 4000 and controlled processing.
Quinoa and bulgur are both nutritious and healthy options. Both foods are rich in protein, vitamins, minerals and dietary fiber and can be part of a healthy diet when consumed in a balanced manner. You can occasionally choose bulgur or quinoa instead of white rice to increase the vitamin, mineral and dietary fiber content of your diet. Especially for people with gluten sensitivity, quinoa is an excellent alternative to bulgur.
For example, you can get more fiber, healthy fatty acids and iron minerals by using quinoa instead of bulgur or rice when making stuffed zucchini. How about trying your stuffed vegetables, pilafs and wraps with quinoa or bulgur?

Discover
Enjoy the Taste of Pizza on World Pizza Day

Enjoy the Taste of Pizza on World Pizza Day

Join the Flavor Feast!

Pizza, prepared with crispy yeast dough and baked in the oven, was traditionally covered with tomato sauce, mozzarella cheese, and various toppings in the old days. However, nowadays, pizza has become a platform that pushes the boundaries of creativity. It can be topped with various savory ingredients, including sauces, meats, vegetables, and cheeses.

As seen, many people may perceive pizza as a low-nutrient food when they choose it. However, published data often show the opposite to be true. In fact, most pizzas are quite high in nutritional value. Serving as a good source of protein, pizza is also rich in complex carbohydrates, vitamins, and minerals.

Quality Control in Pizza Dough!

The pizza industry is a significant sector worldwide, hence there are many top ingredients that vary from country to country. Pizza is generally a flat tart made from bread dough. Pizza dough can be prepared chemically leavened or yeast-leavened. Flour is a basic ingredient in bakery products production, and there are various types of flour with different protein levels and qualities.

Flour Quality and Protein Content

Pizza dough undergoes a process of freezing, storing, and thawing. Therefore, it's important for the flour used in frozen dough to have good strength and high protein content. Hard wheat varieties of flour with a protein content of 11-14% are often preferred for frozen dough products. Determine the protein property of pizza flour with the latest technology DA 9000 NIR device in less than 1 minute!

Global Consumption and Dough Composition

Traditionally consumed in European countries, especially Italy, pizza has commercial appeal in Latin American countries and the United States. This interest is based on reasons such as the low cost of the product and its ease of preparation for consumption. The basic formulation of pizza dough includes flour, water, salt, sugar, and yeast. Dough constitutes a large part of the product, and its appearance, texture, and taste are important characteristics for consumer acceptance and recognition. Therefore, dough quality is crucial as wheat flour, a structural component, and a basic ingredient play an important role in the quality of cooked foods.

Dough Processing and Fermentation

Processing steps responsible for increasing the volume of dough and trapping gas include mixing and shaping the dough, dividing and shaping it, fermentation, stretching, and baking. Fermentation allows the dough to aerate; this occurs through the production of carbon dioxide in the aqueous phase of the dough and the formation of excess internal pressure forcing expansion in the alveoli. The stabilization of alveoli determines the structure and volume of the dough.

Fermentation Conditions and Gluten Properties

The dough is typically fermented at temperatures between 23 and 26 °C with baker's yeast until its initial volume increases 2-5 times or until the fermentation process. Despite most pizza dough production methods being similar, the lack of standardization reflects on parameters such as the appearance, height, texture, and other quality aspects of the final product. Achieving the appearance, consistency, taste, and consistency of the final product requires understanding gluten properties used in pizza dough. It is critical to determine gluten content of the flour used in crepe production for the purpose of identifying viscoelastic properties, baking behavior, and physical quality characteristics.

Desired Characteristics of Pizza Dough

The edges of the pizza should be puffed up and gently browned. The dough should contain various sizes of pores so that the pizza has a light and tasty texture. The pizza dough should not be overly thick or too thin and crispy. For Quality Control in Pizza Dough, meet with Bastak Reology System Absograph 500 & Resistograph 500!

Starch Damage and Dough Balance

Identify the damaged starch amount with the SDCHEQ 15000 DEVICE, optimize your process, and achieve quality in your raw materials!

Pizzas are high in complex carbohydrates, particularly starches. Imbalance in starch damage or low protein levels can result in excessively sticky dough. Conversely, excessive amounts of pentosans and protein content in the flour can create a very loose dough.

Balanced Dough with Bastak Instruments

With leading quality control devices from Bastak Instruments, the density of the dough is just right, the edges are puffy and lightly browned. With different sized pores in each slice, it's the key to that unique flavor. This pizza dough is perfectly balanced, neither too thick nor too thin; it has just the right taste and texture you're looking for. Now, all that's left is to pair this amazing dough with delicious ingredients and start the pizza feast!

Discover
Near-Infrared (NIR) Spectroscopy: Rapid and Non-Destructive Analysis of Grain and Wheat Quality

Near-Infrared (NIR) Spectroscopy: Rapid and Non-Destructive Analysis of Grain and Wheat Quality

Q.C. Food Engineer Selin Yolcu , Q.C. Food Engineer Gülperi Sıla Bardakçı

In recent years, the demand for fast, reliable, and environmentally friendly technologies in food production processes and analyses has been steadily increasing. Accordingly, various innovative technologies have been developed as alternatives to traditional methods. The dependence of traditional methods on equipment, chemical usage, and expert analysts, as well as their time-consuming nature, has boosted interest in these innovative solutions. Among these alternatives, Near-Infrared (NIR) Spectroscopy has emerged as a powerful and efficient technology.

Spectroscopy is the process of measuring and interpreting the electromagnetic radiation absorbed or emitted by atoms, molecules, or ions during transitions between their energy levels. In this context, spectroscopic analyses are instrumental methods that examine the properties of substances such as light absorption, transmission, or reflection.

NIR spectroscopy is based on the interaction of light with matter. Electromagnetic radiation in the wavelength range of 780-2500 nm induces molecular vibrations. Specifically, the vibrations of bonds such as O-H, N-H, and C-H provide information about the chemical and physical properties of grains. Near-Infrared (NIR) Spectroscopy correlates quality attributes of food samples with light absorption in a specific wavelength range of the electromagnetic spectrum. Analyses for interpreting this correlation have enabled the routine use of NIR technology in both physical and chemical analyses of food and agricultural products.

NIR Spectroscopy has become an indispensable part of modern quality control processes, especially in wheat and grain analysis. This technology provides the agriculture and food sectors with the ability to perform rapid and reliable analyses without the use of chemicals. Enhancing the efficiency of food safety and quality management, NIR devices can be utilized both in laboratory settings and in the field.

Key Components:

  • Light Source: Generates infrared light and directs it to the sample.
  • Sample Cell: Holds solid or liquid samples.
  • Detector: Measures the reflected or transmitted light.
  • Spectrometer: Produces the absorption spectrum.
  • Software: Analyzes data and calculates chemical content and physical properties.


Analysis Process:

  1. Sample Preparation: Wheat grains or ground samples are placed in the sampling compartment of the device. The lack of special preparation makes the process highly practical.
  2. Spectral Scanning: Near-infrared light is directed at the sample. The light reflected or absorbed by the sample generates a spectrum based on its molecular structure.
  3. Calibration and Modeling: Using reference models created from previous laboratory tests, variations in the spectral data are analyzed.
  4. Result Interpretation: Quantitative results for parameters such as protein, moisture, gluten, and sedimentation index are reported within seconds.

In a study conducted with Bastak Instruments’ DA 9000 N.I.R Analyzer, wheat samples from various regions in Turkey were analyzed. Within seconds, parameters such as gluten content, protein content, moisture level, ash content, and Zeleny sedimentation values were measured.

With its intuitive 13” touchscreen, next-generation diode array sensor, and the ability to analyze both flour and grain using the same sample cup, the Bastak DA 9000 N.I.R Analyzer provided a fast and user-friendly experience. During the study, the physicochemical properties of wheat samples and the protein content of wheat genotypes were compared using the N.I.R method.

Figure 1: Series 1 represents protein values obtained using the Kjeldahl Method, while Series 2 represents protein values measured by FT-NIR.

Protein levels measured by the Kjeldahl method ranged from 10.21% to 16.34%, while those obtained using the NIR method fell within a range of 10.34% to 16.57% (Figure 1). Samples collected from different regions for the same wheat genotype showed varying levels of similarity between protein values obtained by the two methods.

The accuracy of the measurement results for both methods was found to be high (r = 0.91), indicating a strong correlation in the analysis. This demonstrates that NIR spectroscopy is a reliable method for determining protein content in wheat.

Discover
Near-Infrared Transform (N.I.R) Principle in Food Analysis

Near-Infrared Transform (N.I.R) Principle in Food Analysis

Food chemistry, food microbiology, food physicochemistry, organic chemistry, physical chemistry, general chemistry, biochemistry, instrumental analysis, and nutrition are various branches of food sciences that constitute an international scientific field. It encompasses systems where devices and equipment incorporating all physical, chemical, electrical-electronic, computer, and mechanical technologies and principles are developed and used.

With the continuously growing world population, the diversification of product groups, and the increasing demand for food, the importance of topics such as quality control, food safety, and food assurance significantly affects not only human health but also society, the environment, and ecosystem health.

Bastak Instruments, which has been serving as a Research and Innovation Hub in the fields of food, grain, oilseed, legume, and feed in the world and in Turkey for a quarter of a century, pursues a policy that ensures food safety and assurance, is environmentally friendly, consumer-oriented, sustainable, and fights against scarcity and food waste.

In recent years, there has been a growing interest in rapid, reliable, and environmentally friendly technologies for the analysis of food components. The dependence of traditional methods on multiple devices and chemicals, their time-consuming nature, and the need for an analyst have led to the development of various alternative technologies.

Bastak Instruments, with its international staff and state-of-the-art machinery park in the fields of food science and food technology, has pioneered environmentally friendly technologies using robotic sampling systems, technological and fast solutions that facilitate modern life, and advanced sensors.

Spectroscopic analyses are based on measuring the properties of solutions, such as the absorption, transmission, or reflection of light. The absorption of a specific wavelength of light by a substance is a characteristic feature, much like other physical or chemical properties.

Near-Infrared (NIR) Spectroscopy, one of the widely used technologies as an alternative to traditional food analysis methods, covers the wavelength range of 780 (12800 cm-1) to 2500 nm (4000 cm-1) in the electromagnetic spectrum. It forms absorption bands related to the vibrations of molecular bonds such as O-H, C-H, C-O, and N-H within the structure.

NIR Spectroscopy is based on the principle of correlating the absorption of electromagnetic spectrum in the mentioned wavelength range with the quality characteristics of food samples and resolving this correlation.

NIR Spectroscopy has been extensively researched and practically applied in various areas such as determining the milling properties of cereals, protein and moisture content, wet and dry gluten, Zeleny sedimentation, SDS sedimentation, miksograph peak resistance, gliadin and glutenin, essential amino acids, color, ash, starch damage, water absorption, dough strength, quality characteristics of fermented dough, and rheological properties of dough. It has also been used in researching and obtaining applicable data on determining the energy of various grain products, monitoring structural changes in bread during storage, determining wheat varieties, and quality analysis of bread.

The ICC Method studies using Bastak Instruments' DA 9000 NIR Technology provide users with a unique analysis experience globally, including research and development institutes, universities, quality control laboratories, and industries in many countries, including the United States, Canada, and Europe.

NIR Technique is widely used in the quantitative analysis of various components in fields such as chemistry, pharmacy, agriculture, etc. In the technology of grain, especially; results of quality criteria, including gluten, protein, ash, and sediment, can be determined with high accuracy. Grains can show differences in quality characteristics depending on the climate and soil characteristics of the region where they are grown. Therefore, developing calibration models with new data, obtaining accuracy and reliability of results with a high determination coefficient (R2) value are essential.

This technique does not damage the sample, and samples can be reused repeatedly. Multiple analysis results can be obtained simultaneously with one recorded spectrum. Thus, it is faster, more environmentally friendly, and economical compared to classical methods since no chemicals are used.

Bastak Instruments' NIR technology, which operates on the principle of near-infrared transform, is used in quality controls from raw material supply to the final product control in leading quality control laboratories worldwide. The DA 9000 NIR Devices, which use the NIR Technology, provide a sensitivity of one-thousandth of a millimeter, allowing for quality controls routinely in physical and chemical analyses of food and agricultural products.

Thanks to Bastak Instruments' superior and unparalleled NIR Technology, gluten value, protein value, moisture value, ash value, and Zeleny Sedimentation value in red wheat, white wheat, pasta wheat, and flour samples are measured within seconds.

Discover
Savor the Taste of Crepes on World Crepe Day, Join the Flavor Festival!

Savor the Taste of Crepes on World Crepe Day, Join the Flavor Festival!

Certainly! Here is the English translation of the provided text:

"The pancake, an indispensable part of the gastronomic world, appears as a widely consumed delicacy in many cultures worldwide.

French crepes are predominantly consumed as a traditional festival dessert in the French food industry. About 10% of the total production is exported to the United Kingdom.

The main ingredients of a crepe include flour, eggs, sugar, and butter. The crepe batter is similar to pancake batter but has a much higher water content. The final water content of a cooked crepe, when stored in a sealed package for approximately one month, is similar to that of a pancake (0.75/0.80).

Quality Control in Crepe Batter!

The foundation of the crepe's flavor lies in the quality of the batter. The composition, ratios, and ingredients used in the batter have a decisive impact on the texture and taste of the crepe. Therefore, regular quality control is essential to ensure that the batter consistently meets quality standards.

In sweet crepe batters, soft wheat flour is commonly used. T45 French flour, applicable to France, is often preferred for making crepes. Soft flour used in pastry products like cakes, cookies, and tarts has a protein content ranging from 6% to 11%. This type of flour offers a specific characteristic and stands out with its texture. Its water absorption capacity is 25% to 50% less than that of hard flours. Soft wheat flour has low gluten content (7.5/9) and is an ideal choice to add flavor and texture to pastries and crepes.

Main Quality Control Criteria in Crepe Production:

  • Quality of the main raw material, flour, in the batter
  • Bubble structure of the batter
  • Thickness of the batter
  • Fat content
  • Cooking temperature

For quality control in crepe flour, Bastak Instruments with European Approval ICC No.189 and No. 192 standards are used!

When making crepe batter, water is mixed with gluten to make the batter elastic and give it a soft texture. Starch absorbs water in milk, increasing its volume, and the batter thickens.

Knowing the properties of the gluten used in crepe batter is crucial for the structure and texture of the batter. The flour used in crepe production has low gluten content (7.5/9).

Determine the protein characteristics of the flour with the DA 9000 NIR device in less than a minute using state-of-the-art technology!

Compared to soft wheat flours, hard wheat flours have higher protein content and consequently higher gluten content. Studies show that gluten content in soft wheat flour varies between 15.8% and 42.1%.

Optimize crepe texture with the Bastak Gluten Quality System, which complies with ICC No. 192 standards, with internationally proven results and test accuracy.

Soft wheat flours, when compared, have a characteristic texture due to their protein content of 6% to 11% and low gluten content (7.5/9). Their high-quality starch content enhances liquid gelatinization, resulting in a moist and light texture and a unique flavor.

To achieve the desired appearance, consistency, taste, and texture in the final product, use Bastak Reology System - Absograph 500 & Resistograph 500!

The water absorption capacity or the amount of water the flour can absorb significantly influences the properties of the dough and the final product. The dough's consistency and viscosity depend on the water absorbed by the flour. Using too little water can make the dough hard and dry, while using too much water can make it sticky and challenging to process.

Key quality control criteria for crepes include bubble structure and determining the optimal thickness of the batter. Although crepe batter is similar to pancake batter, it has a higher water content. The thickness of a cooked crepe in French crepes should not exceed 1mm.

For soft wheat lines, absorption varies between 50.7% and 59.0%. The optimum water absorption capacity of wheat flour is 60.2±0.15 (v/w, based on flour weight), arrival time 0.35 minutes, departure time 3.0 minutes, and stability ranging from 2.65 minutes.

Optimize your process by determining the damaged starch amount with the SDCHEQ 15000 device, and achieve quality in your raw materials!

Imbalances in starch damage or low protein levels can result in excessively sticky dough. On the other hand, an excess of pentosan and protein content in flour can create a very loose dough.

Your crepe batter is prepared to perfect standards. What makes your crepe special is the wide range of ingredient options. You can personalize your crepe with ingredients ranging from Nutella and bananas to resin. Whether sweet or savory, it's entirely up to you!"

Discover
How to Make the Most Delicious Donut?

How to Make the Most Delicious Donut?

Donuts are delicious snacks enjoyed with pleasure worldwide.

In its simplest form, donuts are typically made from a dough containing flour, water, sugar, eggs, and usually yeast or baking powder. The dough is then shaped into circles or other forms, fried to a golden brown in hot oil, and then coated with sugar, glaze, or other toppings.

The key to creating a true flavor celebration in donut production lies not only in the dough processing process but also in quality ingredients and quality control processes. Establishing an effective quality control system in the donut production process is crucial for elevating customer satisfaction, minimizing costs, labor, and time losses in the production process, and increasing brand value.

Let's take a look at our most delicious donut recipe!

The production of the most delicious donuts usually starts with wheat-based flour. Therefore, knowing the physical, chemical, and rheological properties of the flour to be used in production is critical for both the producer and the consumer.

The moisture content of donuts is directly related to the quality of the final product, which is flour. The adverse effects of moisture factors during storage can lead to sensory changes, causing the sugar on the donut surface to dissolve and loss of smoothness.

With the high-precision sensors coated in gold on Bastak Moisture Meter Device, moisture analysis is performed in 40 different sample types within 8-10 seconds in compliance with international standards.

The effects of starch, as the basic component of flour, vary depending on the damaged starch amount. Usually, 70-75% of flour consists of starch, but this ratio can vary depending on diversities and environmental factors. When the dough is kneaded, starch interacts with water, protein, fat, and other molecules, playing a crucial role, especially in gluten binding, as a filling material. Damaged starch granules absorb four times more water than undamaged starch.

Lack of damaged starch or low protein levels can lead to excessively sticky dough. On the other hand, excessive pentosan and protein in flour can create a very brittle dough. Instead of long and tedious analyzes to determine the damaged starch value, opt for the efficient Bastak 15000 SD Check! By detecting the amount of damaged starch with the SDCHEQ 15000 Device, optimize your process in donut production and capture quality in raw materials!

In order to achieve perfection in donuts with the DA 9000 NIR Device by Bastak Instruments, which operates on the principle of near-infrared transform with NIR technology, which includes in international standards from raw material supply to final product control in all processes, determine the protein content of flour in less than a minute.

Our flour, with Bastak Instruments' devices with precision control up to a thousandth of a millimeter, passed quality control tests with European-approved ICC No.189 and 192 standards, proving its excellent quality in the international arena!

Things to consider for a great dough; Let's start by obtaining a delicious dough. To achieve an ideal and quality dough in donut production, let's start with quality control tests on flour. When flour is mixed with water, it contains proteins called gluten and gliadin, which form gluten when mixed with water. Gluten provides the elasticity of the dough and allows it to expand without breaking, which is important for forming the structure of the donut.

Achieve optimization in Donut Texture with Bastak Gluten Quality System! Gluten strands, interacting with other strands and molecules, form networks that provide the flexibility of the dough. Bastak Gluten Q-System has ICC No. 192 standard, and its results and test accuracy have been proven in the international arena.

To achieve the perfect dough consistency in donuts, it is important to observe the amount of water added to the mixture correctly. If the dough contains too much water, it can cause the donuts to look defective, create large holes, and absorb more oil. If the dough is too firm, it results in a thick crust, a rough and broken surface on one side, and excessive oil absorption in cracks.

Insufficient kneading of the dough can result in a very firm and elastic product, requiring a longer fermentation time and not filling the baking tray or paper to the desired extent. Insufficient kneading generally produces a low-volume, dense, poorly symmetrical, or collapsed final product. Over-kneading the dough, on the other hand, can result in process difficulties such as excessively sticky dough, too loose elasticity, yielding donuts with excessive volume, large crumb bubbles, and other unwanted characteristics.

In donuts; Use Bastak Reology System Absograph 500 & Resistograph 500 to capture the appearance, consistency, and quality, taste, and consistency;! The unmatched and state-of-the-art reology system of Bastak Instruments provides the ideal dough consistency. Options of Bastak Absograph 500 & Resistograph 500 with universal standards offer perfect process optimization for the manufacturer at this critical stage by evaluating dough properties.

Finally, to make your dough super soft, add a little love and a little sugar.

Discover